Google Analytics Audit
For those who know what they want it's not just following any kind of path that matters. A Google Analytics Audit answers the questions. We just have to formulate them. This service allows you to draw conclusions about a website that may be important for making decisions for any business.
WE GATHER VALUABLE INFORMATION FROM NUMBERS!

Measure, Analyze, Understand
The Google Analytics tool allows you to monitor any number of activities that take place on a website in a specific time scale or dimension: country, city, browser, language, operating system and much more.
Essentially, the numbers and results in isolation mean little, we want to find trends and study patterns of behavior of the users. We want to answer the following questions:
Real Time
What is happening now? How many visitors does the site have right now?
Audience
Who are the website´s visitors? Are most users of the site women or men?
Acquisition
How did they get there? Did they come from Facebook or through Google search?
Behavior
What do they do on the website? Do they come for products in the store?
Conversions
How much are they worth? How many make a purchase?

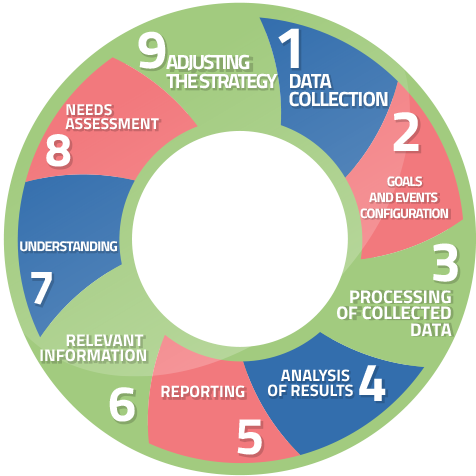
A Performance Cycle: Relevant Information
The Google Analytics Audit is a cyclical and continuous process, since the collection of information only takes on a meaning if we understand it and if we use it to adjust a strategy, thus refining and improving the information acquired.

Different metrics for different websites
Each website - be it e-commerce, blog or institutional - must use the metrics that best suit the objectives and types of conversions it intends to achieve.
The types of conversions are divided according to their importance in macro conversions - such as finalizing a purchase, calling a potential customer, asking for a quote, following on the social network, filling out a form - and conversions that may be interesting to measure - downloading files, content sharing on the social network, newsletter subscription, walking a certain path within the website, staying on the website for a certain time.
Here are some examples of key performance indicators or KPI’s that we evaluate at Grow Under:
-
Time on site
-
Conversion rate
-
Time per page
-
Visits
-
New Visits
-
Bounce Rate
-
Clicks
-
Impressions
-
Cost Per Click
-
Viewing exclusive pages
All this information is compiled and delivered to the client in the form of a monthly / quarterly / semiannual report, with the indication of the main results and their interpretation carried out by the Grow Under team.
Start monitoring your website today!
Learn more about...
Ready to get started?
Ask us for a detailed quote of what you need or take a look at our pricing to get an idea of how much it might cost you to provide our services.
SUBSCRIBE OUR NEWSLETTER
Receive in your email the latest promotions, news releases and the events to which we are related.


